

Does marketing feel mysterious to you? Does it feel like you are throwing dollars into an unknowable void and hoping that new patients come out of it? You’re not alone.
Historically, marketing has always been hard to measure. Who can say what’s really bringing in new patients; your sign out front, word of mouth, or something else entirely? If you don’t know which marketing efforts are responsible for growth, it becomes near-impossible to profitably ramp up your marketing.
The good news is that today, technology exists that can effectively remove the shroud of mystery that surrounds your marketing. You can clearly know which marketing channels are making you money and which are quietly killing your bottom-line.
This article will walk you through a 4-step process of setting up a marketing data collection and analysis strategy. If you follow these steps, you’ll be well on your way to understanding which marketing pays off and which marketing to lay off.
Let’s dive in!
Step 1: Identify Each of Your Marketing Channels
The first step is simple enough: take a look at any areas where you invest time and resources into generating business. This includes digital media, traditional media, and everything in between.
Your list might look something like this:
- Google Ads
- Facebook Ads/Sponsored Posts
- SEO
- Review Generation Software
- Email Marketing
- Social Media
- Radio
- YouTube Ads
- Billboard/Outdoor Signage
- Mailers/Flyers
- Community Newspaper
Step 2: Where Possible, Set Up Tracking for Each Channel
Let’s work off the list in Step 1 to see what’s trackable and what isn’t.
Very Hard to Track
The following channels will be very difficult to track:
- Billboard/Outdoor Signage
- Radio
Method: The only hope for these channels is to ask your patients how they found out about you. This is a great habit to have your staff develop for all channels. Of course, the results of this questioning need to be documented in an easily accessible way if it’s ever going to be useful.
Somewhat Hard to Track
These channels cannot be tracked perfectly or easily, but options exist:
- Community Newspaper
- Mailers/Flyers
Method: The secret with any non-digital print advertising is to use distinct call tracking numbers. There is special software that gives you a unique phone number. The number forwards calls to your office line, tracking exactly how many calls came through. The end result is a report that will tell you X number of calls came from the newspaper whereas Y number of calls came from the fridge magnets you mailed out, for example.
CallRail, PhoneWagon, TeleCapture, or WhatConverts are all good software options for this method.
Easy to Track
In the digital world, things get a lot easier to track; mostly everything else on the list falls under this category.
Method: At the end of the day, you want to know which marketing is contributing to 3 goals: phone calls, online bookings, or walk-ins.
Walk-ins (for now) can only be tracked by asking patients how they heard about you. Eventually, technology will be widely accessible where geofencing will be accurate enough to track this for small businesses.
Online submissions are fairly easy to track if you have Google Analytics installed on your site. Most form software integrates with Google Analytics directly and will have an easy guide on how to get this setup. If you don’t have access to that information, this article may be helpful.
Phone calls are the most difficult to track, but it’s still very possible using a call-tracking solution like the ones I mentioned above. While most of these solutions have offline phone numbers you can use for print and billboards, they also have online options that let you track exactly which web page your caller came from. This is done through something magical called dynamic number insertion, or DNI, which I won’t get into here. This isn’t free, but the amount you’ll save by not investing in poor-returning marketing is more than worth it.
Here is an example of a report from the software we use to do this:
![]()
![]()
Beautiful, right? Our reports even show which Google Ad campaigns and ad groups led to the calls.
Step 3: Gather Your Data Together in One Place
While this step might not seem necessary, it absolutely is. Looking at data from different sources in different reports and trying to piece it all together is time-consuming and difficult. It’s worth the effort to get all your data in one place where it can be analyzed together.
My recommendation is to gather it all together into Google Analytics. Most of the data lives there in the first place, and it’s fairly easy to import the rest of the data. Here is an explanation on how to get each major marketing channel imported into Google Analytics:
Google Ads
As a Google product, the integration is almost too easy. From within Google Analytics, click on “Admin.”
From there, you’ll see “Google Ads Linking” front and centre.
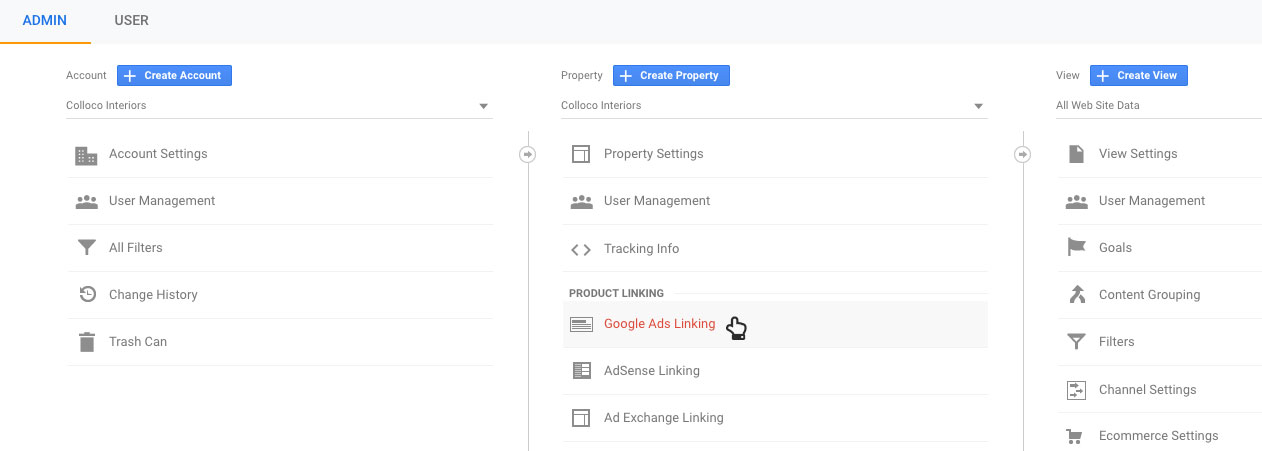
As long as your Google Ads account uses the same email address as your Analytics account, you’ll be able to navigate to your account and create a linking. Congratulations! All of your Google Ads data can now be found in Analytics.
Note that since YouTube advertising is managed through Google Ads, this integration will pull that data in as well.
Facebook/Instagram/Pinterest/Other Digital Advertising
For other paid digital channels, the current best practice is to use URL parameters. Simply put, you add some extra stuff at the end of the URL you put in the ads running on these platforms, which tells Google Analytics where the visits come from.
The easiest way to do this is to build this trackable URL using Google’s tool. Here, you can help Google identify the Source, Medium, and Campaign that the ad is driving traffic from.
The Source is the platform, like “Facebook,” “Instagram,” or “Pinterest”. The Medium is the type of traffic, like paid, organic or email. For paid campaigns, you have to designate the medium as “CPC” (short for cost-per-click). The Campaign is the specific campaign you are running on the platform. It’s best practice to use all lowercase and dashes instead of spaces when using the tool.
If you were a dentist running an ad on Facebook promoting your summer campaign, you would use the tool as shown in the image below:
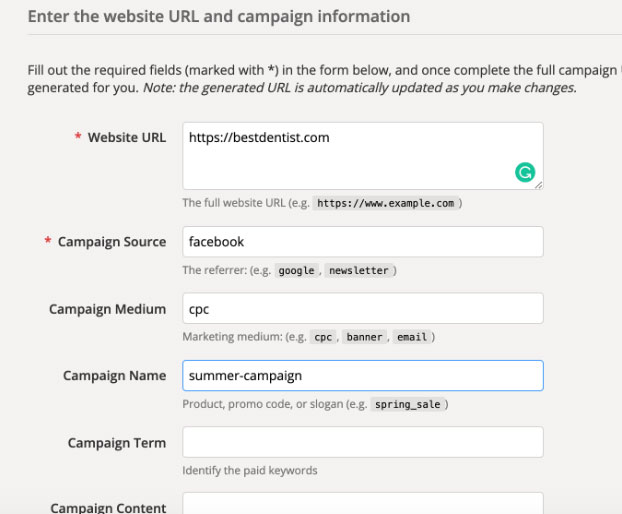
When creating the Facebook ad, you would send traffic to the generated URL:
https://bestdentist.com/?utm_source=facebook&utm_medium=cpc&utm_campaign=summer-campaign
This info will be able to identify the source of website visits, but it doesn’t import one of your most important metrics – cost. If the hassle isn’t too big, you can simply cross-reference your ad cost from within the external ad platform with your Google Analytics data. However, if you’re truly lazy like I am, you can import ad spend data using third-party tools. My favourite is Supermetrics.
SEO
Much of this is tracked automatically, but if you want to enable a deeper layer of SEO tracking, you’ll want to enable something called “Google Search Console.” This will help determine which keywords are bringing in the most website visitors.
Instructions on setting up Search Console can be found here.
Email Marketing
There’s a good chance that your email traffic will already tag a person as coming in from “email,” but it’s still a good idea to label things correctly here. To do this, we use the same process as the Facebook/Other digital ads, but we change a few fields for the Google URL Tool.
Source: [input your email provider, like MailChimp or ConstantContact]
Medium: email
Campaign [enter campaign name]
Now all traffic from emails will be easily identifiable for you to analyze later.
Social Media
Good news! Google Analytics is pretty good at deciphering your social media traffic. You won’t be able to view metrics such as “likes” or “shares,” but you will be able to analyze site visits (which is what matters most at the end of the day).
Step 4: Analyze Your Data
If you’ve completed the first three steps in this guide, you have a metaphorical Porsche of data in your digital garage right now. Don’t leave it parked – put it to use! Be… wait for it… data-driven!
Don’t worry, I smacked my own forehead with that one. Puns aside, your data is only as useful as you let it be so it’s crucial to know which metrics you should be tracking. Below are the 2 Google Analytics reports you should know soup to nuts.
Reminder: Remember to be aware of the date range you are viewing. More time equals more data which equals more statistical significance, but if you set the range to be too large then things like seasonality, changes in ad spend, etc. can skew the whole data set. For dentists, I typically look at a 30-day window.
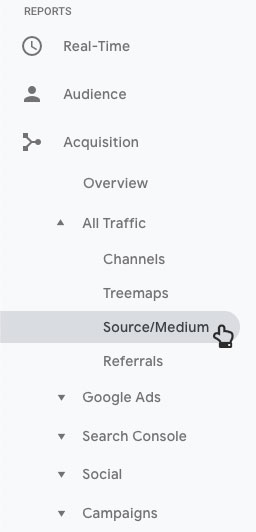
1 – Source/Medium Report
Navigate to this report by going to Acquisition -> All Traffic -> Source/Medium
This is my go-to report; I spend 95% of my time in Google Analytics here. It provides data for valuable metrics broken down by marketing channel.
Here are the metrics you should pay close attention to:
Users/Sessions
Where do most of your site visitors come from? This column gives you a volume and percent breakdown of where your traffic originates.
Bounce Rate
This is the percent of visitors that leave your site without interacting with it in any way. Typically, a high bounce rate on a channel means that the quality of traffic from that channel is poor.
Start worrying if your bounce rate is over 60-70%.
Goal Completions
This is likely the most important column in this (or any other) report. Where is the highest volume of leads coming from? At the end of the day, you should be investing your money where the leads are flowing. That being said, this should be done with a grain of salt – the grain being the next metric…
Goal Conversion Rate
This metric shows which channel is generating the highest quality traffic. Your conversion rate is the percentage of website visitors that complete a goal, like calling your practice for example. The higher your conversion rate, the more you should invest in that channel.
If Facebook Ads converts at 10% where Google Ads converts at 5%, that means every dollar invested into Facebook will generate twice as much as Google (all other things being equal). This exact example is something I’ve used to direct clients on marketing spend more times than I can count.
Let’s dive even deeper.
Rather than navigate to all of the other reports to get answers about the data, you can satisfy most of your questions with the “Secondary dimension” function within the Source/Medium report. This dropdown lives at the top of the table and can be used to segment your data even further. The important dimensions you will want to use are:
- Gender
- Age
- Day of Week
- Device Category
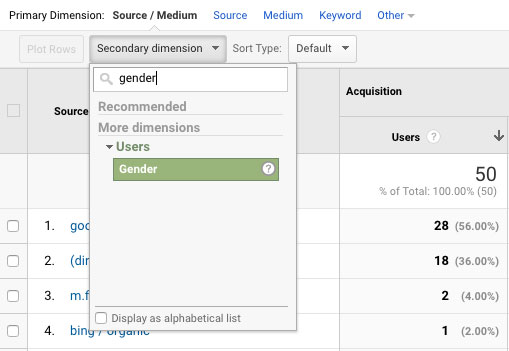
How is this valuable? Let’s say your Google/CPC (Google Ads) traffic is split 50/50 between desktop and mobile. Let’s further say that 90% of your Goal Completions came from mobile. Mobile users convert better than desktop! You now have a tactical change to make with your Google Ads – reallocate spend to favour mobile devices.

2 – Social Overview/Conversions
Navigate to this report by going to Acquisition -> Social -> Overview or Conversion
The Overview report is useful because it shows a breakdown of your traffic from each social channel. It goes even further and shows how many conversions you received from social compared to all other conversions.
Navigate to the Conversions tab, then click on the “Assisted vs. Last Interaction Analysis” tab.
This report is incredibly useful; it not only shows which social channels led directly to a conversion, but it also includes “Assisted Conversions,” which means that the converter had a social interaction before converting through a different channel.
For example, a person may have seen an Instagram post you made, then searched for your practice on Google. The lead would go to Google Organic in all other reports, but this report would give some credit to the social channel really responsible.
To Sum it All Up
It is possible for you to know which marketing channel is working best for you. It is possible for you to stop wasting money where there is no return on the investment. It is possible to take control of your marketing data.
This article gave a general strategy on how to collect and analyze data, but I’d like to make it clear that each individual section could be an article in and of itself. Hopefully, this gives you some tools to step up your data game. If you would like to talk more in depth about any of these topics, it’s what I love to do, so drop me a line at johnny@smileshopmarketing.com.